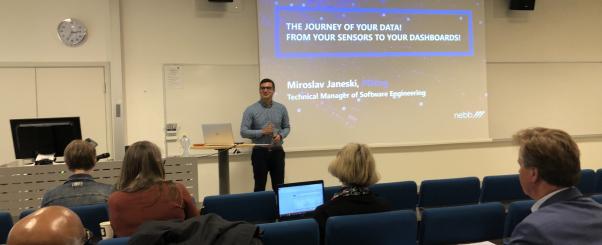
 “The Journey Of Your Data! From Your Sensors To Your Dashboards!” is the title of the talk I gave at the last industry-science meetup organized by the University of South-Eastern Norway (USN) and Energy Valley. The meetup aimed to create an arena where regional high-tech industry players from the energy and engineering sector can meet and interact with strategic research initiatives, interdisciplinary research, and science groups from USN. Since the goal of the meetup was to show results from applying the latest state-of-art research in solving real industry problems, we have decided to give a technology introduction to Qlarm. My talk was a high-level journey on making the most important architectural design decisions that one must make while designing a solution like Qlarm.
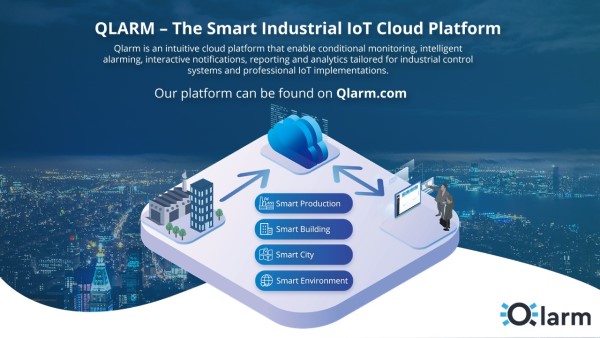 Qlarm is an intuitive cloud platform that enables conditional monitoring, intelligent alarming, interactive notifications, reporting, and analytics tailored for industrial control systems and industrial IoT implementations. As a solution, Qlarm is the result of many years of experience in control systems, deep understanding of the core industrial problems, and Nebb’s recent R&D activities in cloud technologies and machine learning. Namely, one of the core services of Nebb is the design and implementation of complex control systems in various domains. The task at hand was to find a way to transform raw sensor data into meaningful information for our customers. Qlarm is not only doing that but going a step further. With Nebb’s cloud-based industrial IoT and control system cloud platform we bring to the table more benefits for our customers.
Cloud Gateway
When you build a cloud industrial control system or industrial IoT solution, all the sensor data will arrive at a certain endpoint in your cloud solution. You might have a couple of gateways in between, or mesh communication among the sensors, but eventually, the data will hit certain cloud endpoint. The cloud endpoint acts as a central message hub for bi-directional communication between your IoT application and the devices it manages. In general, the cloud gateway is defined by the following quality attributes:
- Security: Security is equally important all over the solution. The cloud endpoint is the entry point in our cloud solution. It is essential that we control which sensor and what kind of data is to be sent at a given time frame.
- Scalability: If our customers want to introduce more measuring points or more production units to monitor, then we must support that. The increased ratio of data messages/second must be supported out of the box.
- Interoperability: The modern cloud solutions must scale in the number of endpoints (Industrial IoT or control systems), but also in the variety of the endpoints. The supported communication protocols can define the interoperability of the solution. There are a couple of protocols that are already accepted as standard, but still different products support and require different communication protocols.
- Reliability: The cloud endpoint must be reliable, and it’s not allowed to lose any sensor data. Integrated buffer is one way to achieve higher reliability.
Time-Series Database
We already know how to get the sensor data to the cloud. Before we do anything with the data, we need to store it. To decide on the storage technology, we have to see what the structure of our data actually is. Namely, our data, both from Industrial IoT and control systems, is data that measures how things such as equipment, condition, weather, etc., change over time. The time is not just a metric, but a primary axis. This type of data is time-series data, and since we are dealing with time-series data, a logical solution is to use a time-series database (TSDB). The time-series databases are the most popular DB engines in the last two years and there are solid reasons for that:
- Scalability: Time-series data accumulates very quickly, and normal databases are not designed to handle that scale. Time-series databases handle scale by introducing efficiencies that are only possible when you treat time as a first-class citizen.
- Usability: TSDBs also typically include functions and operations common to time-series data analysis, such as data retention policies, continuous queries, flexible time aggregations, etc.
Serverless Architecture
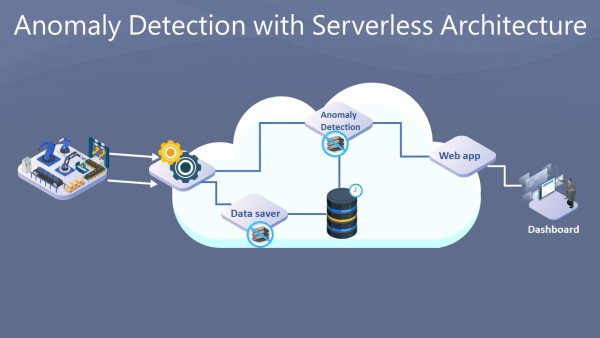
So far, our data will reach to the cloud, and we know how and where to store it, but there is still one more thing missing between these two components. The cloud endpoint is not responsible for data storage, neither is the time-series database for data ingestion. Looking back at the quality attributes of the first two components, what they have in common is scalability. Both the cloud endpoint and the time-series database can scale to support more messages per second. The component in the middle must support this scalability; otherwise, we lose the scalability of the solution. To achieve solution-wide scalability we can use Serverless Architecture pattern. Serverless Architecture is a software design pattern where applications are hosted by a third-party service, eliminating the need for server software and hardware management by the developer. Applications are broken down into individual functions that can be invoked and scaled individually. The main benefits of Serverless Architecture are infinite and instant scalability and pay per use. That means if we have more load, then the third-party provider will almost instantly scale to handle the load and also we will get charged only for the used resources. If there is no load, the customers don’t have to pay anything.
Functional Dashboards
So far, we managed to get the data from the sensors to the cloud and what we have is data, but do we have the information? From a developer point of view, the solution is almost ready, but from a customer point of view, we have nothing. The next thing is to build a web application that will display the data. Showing the raw time-series data is not enough. Customers demand meaningful information. Therefore, we need to design appropriate dashboards. There are multiple popular ways to categorize dashboard based on their purpose (Analytical, Strategic, Operational, Tactical, etc.). The operational dashboard is a digital version of the control rooms. They provide almost “real-time” information to the operators so they can act quickly. Very common dashboard type for this purpose is a “Live View” dashboard, where the latest sensor values are shown. However, showing the latest values from all the sensors and control systems is not useful enough. It will end up in broken UX very soon. A human being cannot extract meaningful information from about 10,000 sensor values. One thing that can help is showing only the sensors or control systems with anomalies. But how to detect an anomaly? One way is to use fixed thresholds. For instance, if the engine temperature is over 100 degrees, then you can show it on the dashboard. This approach is an improvement, but still, it has some disadvantages. First, it’s a manual work to enter all the thresholds, and second, the thresholds can change over time. Due to physical deterioration, the equipment can be depreciated, or the environment might change, and the thresholds are not valid anymore. On a large-scale solution with thousands of industrial IoT sensors or control systems, this can be very difficult to maintain.
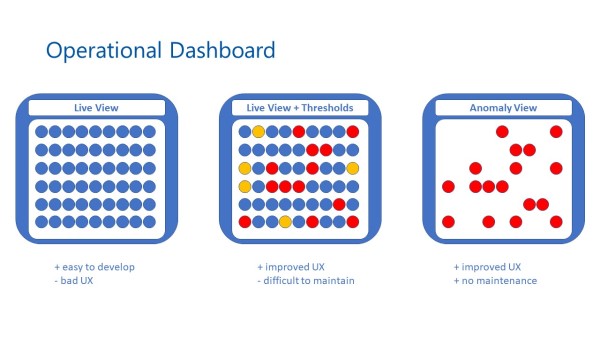
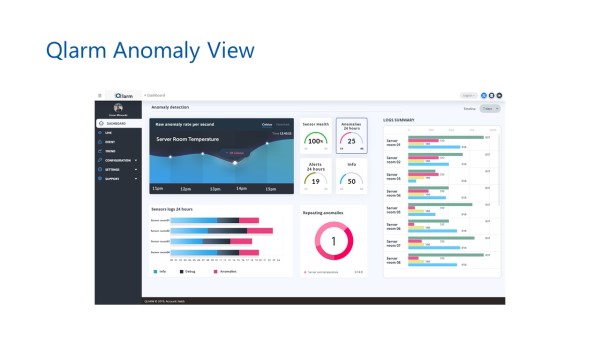
What if we can automatically detect an anomaly in the sensor data and display only the anomalies on the operational dashboard? In that case, we don’t overload the customer with information, and we show only the important information: We detect an anomaly in the second engine of production process X. Do you know the customer’s answer on this? Yes, that’s what we want! Great, we’ve found something that our customers need. Now, we need to make it happen. Fortunately, there is a solution that fits into our architecture very well. For time-series data anomaly detection, there are already mature algorithms that give highly reliable results. There are also libraries that implement the algorithms and enable running in a stateless fashion. Based on this, we can create a serverless component that will run the time-series anomaly detection algorithm on each stream of data and push only the detected anomalies to the dashboard.
We live in a time where technology changes faster than ever. One wrong design decision in your solution can reduce your time to market and that can lead to lost opportunities. In the journey, we have shown how proper architectural reasoning can result in a scalable and functional product such as Qlarm. If Qlarm is what you need or you want to find out more, feel free to reach out to us.